Originally posted on twitter.
Does anyone else use the imgcat library to show matplotlib plots directly in iTerm?
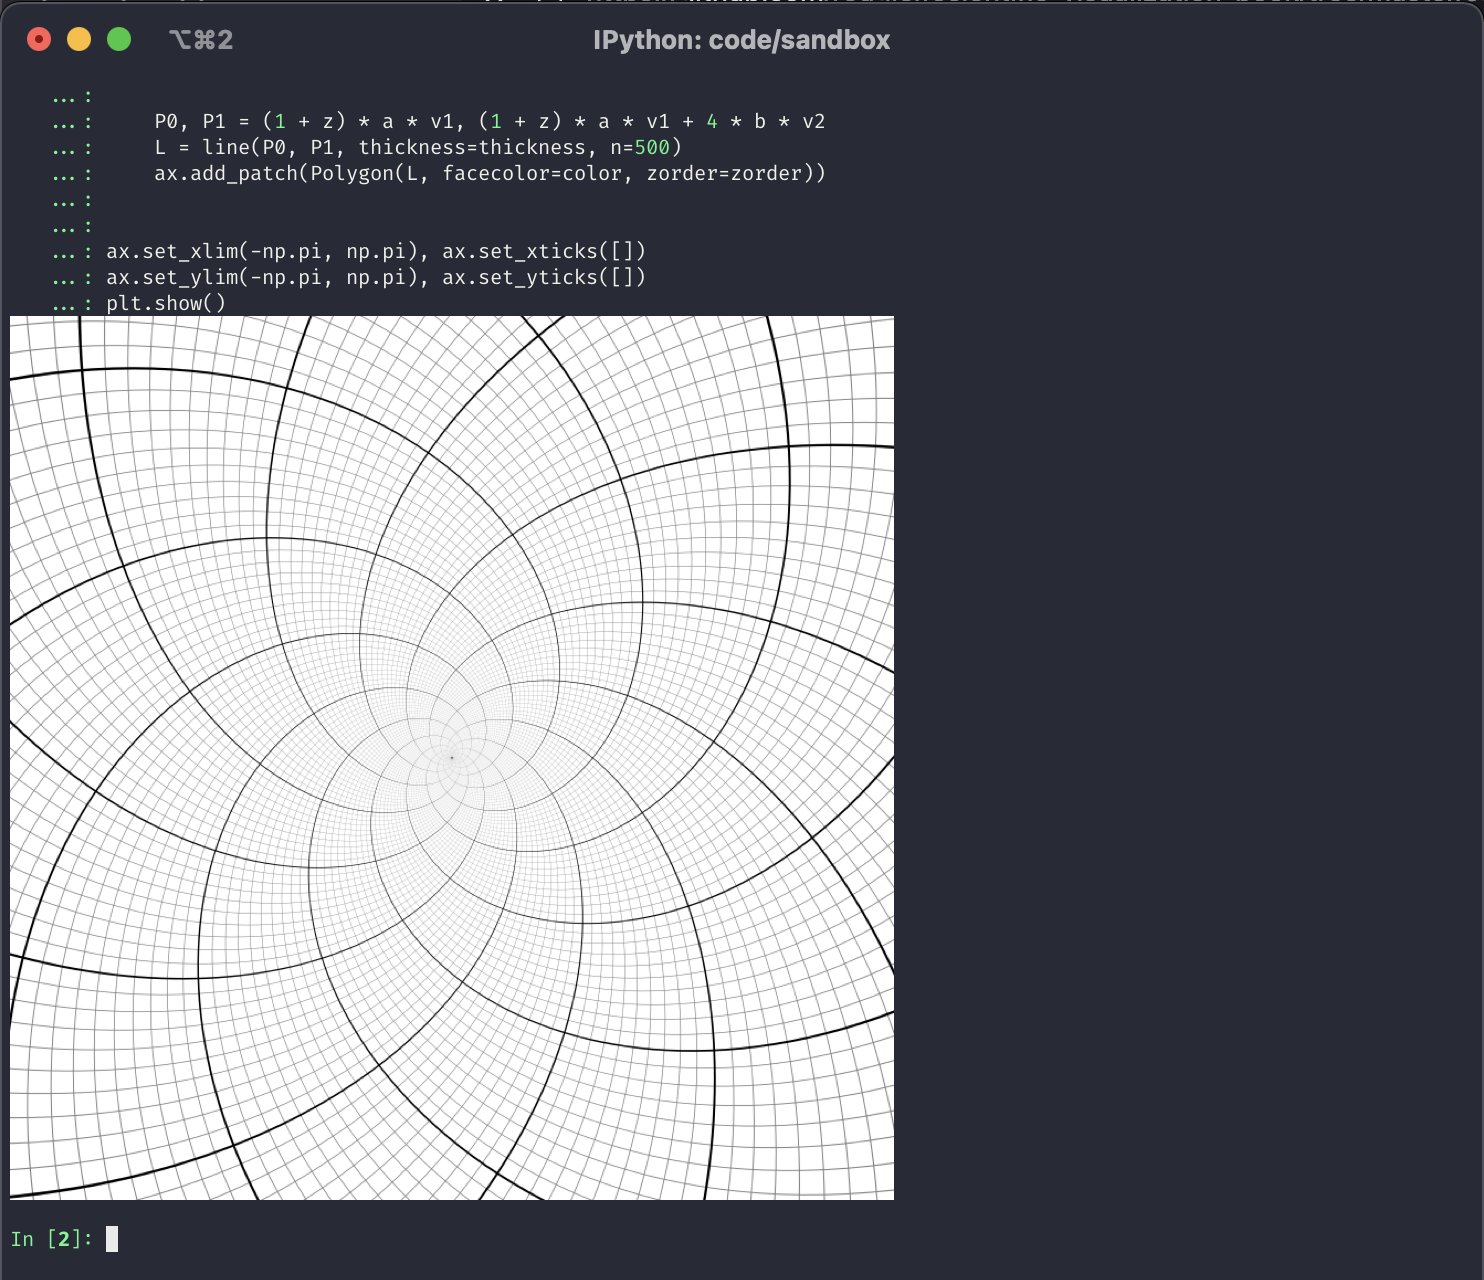
Image credits: Nicolas P. Rougier's Scientific Visualization book
Yes, plotting in Jupyter is nicer...but I think it's pretty neat that this is possible. And sometimes it's quicker too 😁
How to set it up
Here's how I set this up in a sandbox virtualenv that I use for fooling around:
pip install imgcat ipython matplotlib numpy pandas
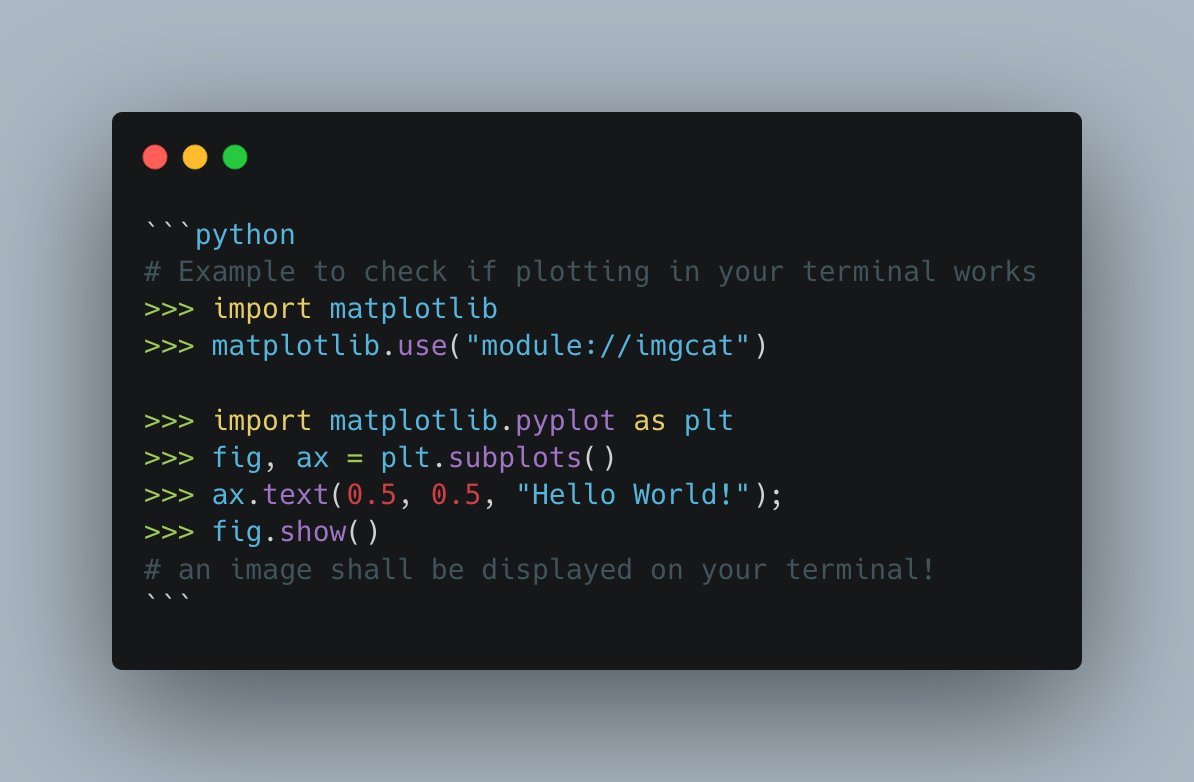
Then confirm the plotting works by running this in a Python console:
import matplotlib.pyplot as plt
import numpy as np
from imgcat import imgcat

# Create a simple plot
fig = plt.figure(figsize=(4, 3))
x = np.linspace(-3, 3, 100)
plt.plot(x, np.sin(x))
plt.tight_layout()

# Display directly in terminal
imgcat(fig)
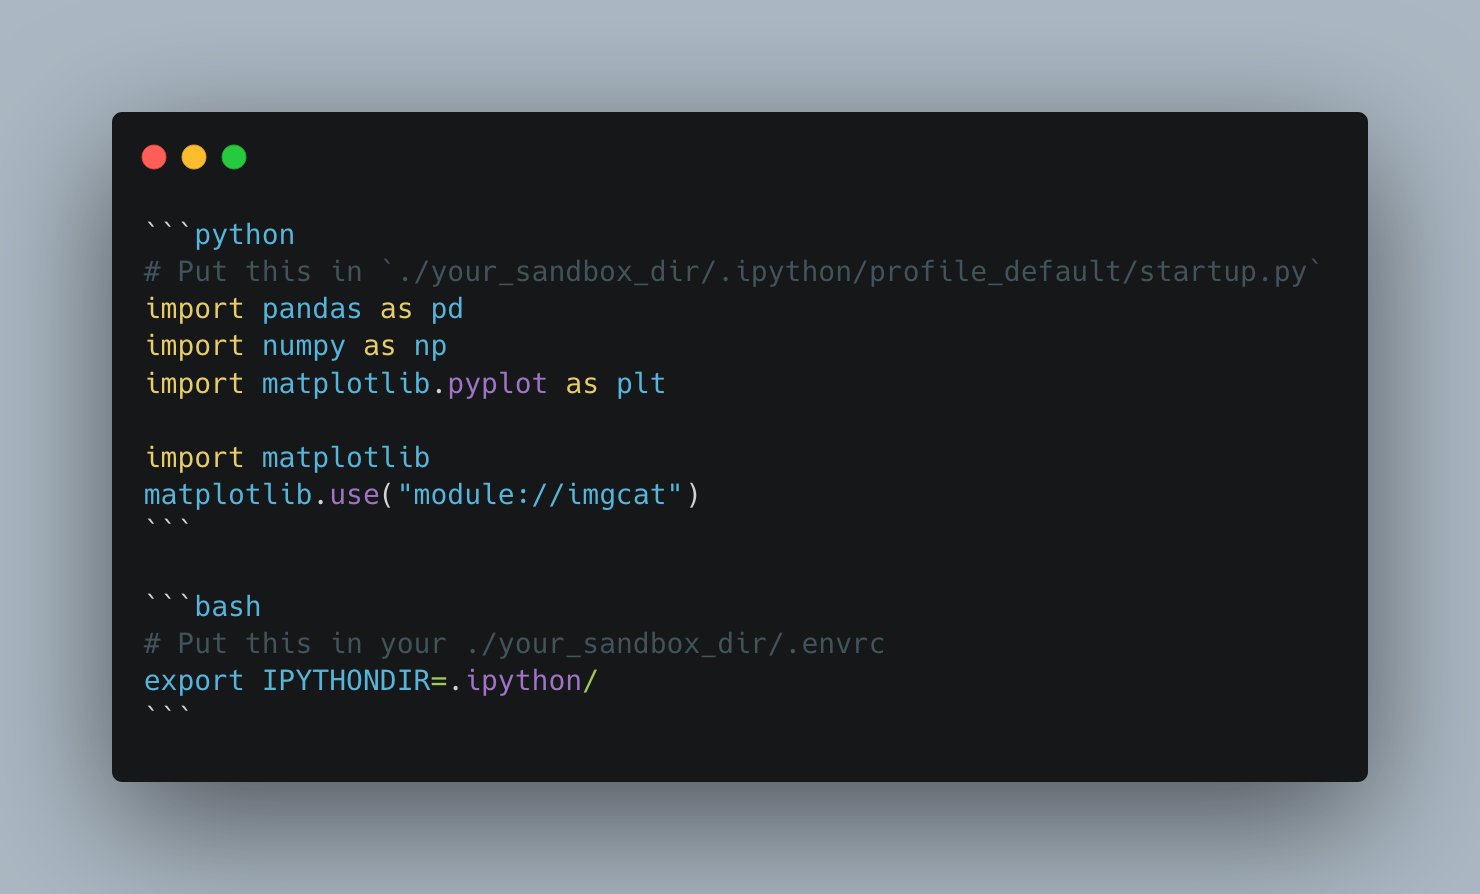
Making it even easier with ipython startup
Typing those import lines gets tiresome quickly. That's why I use a local ipython startup file that auto loads everything I need.
Direnv then automatically (un)loads that startup script when you leave/enter the sandbox directory.
If you don't know about direnv yet, check it out. It's pretty neat!